“No inflation” under Trump; Biden inflation “worst in our nation's history” / 21%
“no inflation, virtually no inflation”
What it asserts
That (a) there was zero inflation in 2017–21, and (b) inflation under Biden was record-high, quantified at 21% — Trump also called it “the highest inflation perhaps in the history of our country” / “like very few people have ever seen before… We were at 21 percent.” (Wording as quoted by FactCheck.org.)
What the record shows
BLS CPI, via FactCheck.org: CPI rose 7.6% cumulatively under Trump (average 1.9% per year) — low, not zero. Under Biden, the largest 12-month CPI rise was 9.1% (year to June 2022), then 2.9% in the year to July 2024; the cumulative rise under Biden to that point was 19.4%, and over his full term (January 2021 to January 2025) FactCheck.org’s final tally put it at 21.5% — which explains where the “21%” figure comes from, but it is a cumulative multi-year rise, not an annual inflation rate and not a record. The largest 12-month CPI increase on record was 23.7% (June 1919–June 1920, BLS centenary publication). What drove inflation in each period is summarised in the key-points box below.
What drove inflation in each period — key points
Trump years, 2017–20 — low, not zero
- The record: CPI rose 2.1% in 2017, 2.4% in 2018, 1.8% in 2019 and 1.2% in 2020 — averaging about 1.9% a year, about 7.6% cumulatively.
- Why it stayed low: a stable global economy, steady energy prices and well-anchored inflation expectations, with the Federal Reserve keeping inflation close to its 2% target. No large supply shock hit in 2017–19.
- 2020 — collapse, not stimulus, dominated: COVID shut down travel, hospitality and much services spending and oil prices collapsed (the Fed noted “weak aggregate demand and low oil prices have held down consumer price inflation”), so the year ended at just 1.2% despite the CARES Act. Support propped up incomes while spending outlets were closed — households built up excess savings of about $2.3 trillion by Q3 2021, a store of demand released later.
Biden years, 2021–24 — why it surged, then eased
- Demand rebound, tilted to goods: as the economy reopened, spending snapped back and shifted from services to goods — cars, furniture, electronics — putting intense pressure on a limited supply of goods.
- Supply could not keep up: pandemic supply-chain bottlenecks, port congestion, semiconductor shortages that cut car production, and labour shortages across transport, warehousing and services.
- Stimulus and loose money: about $5 trillion in pandemic aid in total — the CARES Act ($2.2tn, 2020), the December 2020 package ($900bn) and the American Rescue Plan ($1.9tn, March 2021) — while the Fed held rates near zero until March 2022 and treated the early rise as “transitory”.
- Energy and food shock, 2022: Russia’s invasion of Ukraine in February 2022 pushed oil above $100 a barrel and disrupted wheat and fertiliser supplies; US fuel prices rose 49% between January and June 2022 — the month headline CPI peaked at 9.1%.
- Housing and a tight jobs market: a long-running housing shortage fed rising rents and shelter costs, which reach CPI with a lag and stayed high into 2023, while very tight labour markets sustained wage and services pressure after goods inflation faded.
How much did stimulus contribute? Estimates differ — read as a range
- San Francisco Fed, early estimate — Rescue Plan alone: about 0.3 percentage points on core PCE inflation in 2021, and a bit more than 0.2 points in 2022.
- San Francisco Fed, later cross-country comparison — all US fiscal support combined: about 3 percentage points by the end of 2021. That is a broader measure: it covers Trump-era as well as Biden-era support, so it is not comparable like-for-like with the Rescue-Plan-only figure above.
- Other estimates put the American Rescue Plan’s own contribution at roughly 1–2 percentage points at its peak. There is no single consensus number — the spread between estimates is itself part of the record.
- Global context: inflation surged at the same time in most advanced economies, including countries with no Rescue-Plan-scale package. Bernanke & Blanchard (2023), in the most-cited decomposition, found the early US surge was mainly shocks to prices given wages — energy, food and sectoral shortages — with tight labour markets becoming more important later, as those shocks faded.
Why it then came down, 2023–24
- Supply chains normalised, shipping costs and goods shortages unwound, and energy prices fell back from their 2022 peaks (CBO: inflation cooled in 2023 as demand for goods weakened and food and energy markets softened).
- The Fed raised rates from near zero to 5.25–5.50% by July 2023, cooling demand. Annual CPI fell from 9.1% in June 2022 to 2.9% in the year to July 2024 and about 3% by January 2025 — the rate fell; the higher price level (about 21% above January 2021) stayed.
Second term, 2025–26 — starting point
- Inherited, then easing into 2025: CPI was 3.0% in January 2025 when Trump returned, fell to 2.3% in April 2025, was back at 3.0% in September 2025, and full-year 2025 came in at 2.7% in December 2025 (December-to-December), down slightly from 2.9% in December 2024 — lower, not zero.
- Average so far: about 2.9–3.0% average 12-month CPI through August/September 2026, with prices up about 5.4% cumulatively between January 2025 and September 2026 (seasonally adjusted, per CNN’s tally of BLS data). A lower inflation rate means prices rising more slowly — not prices falling.
Tariffs in 2025 — real, but smaller than the loudest forecasts; estimates disagree
- Scale: sweeping tariffs announced in April 2025; customs revenue was $264 billion in calendar 2025 and the effective tariff rate was 7.7% (Tax Foundation) — the highest since 1947.
- Contribution to inflation — present as a range, because sources measure different things: CBO: about 0.4 percentage points to annual inflation across 2025–2026 and about 0.9% to the price level by 2026, temporary. Oxford Economics: about 0.5 points in 2025. Morningstar: about 0.3 points in 2025. Federal Reserve Bank of New York: tariffs had added nearly 3 points to consumer-goods inflation by February 2026, with the effect on the goods price level easing to about 2 points by August 2026. The New York Fed figure is goods-only and a price-level effect, not headline CPI — that scope difference explains much of the apparent disagreement; do not average these figures together.
- Why pass-through was muted at first: firms stockpiled imports ahead of the tariffs and absorbed some costs in margins, so the effect arrived with a lag. Lingering pass-through was still being cited in September 2026 — apparel up 0.3% and toys rebounding 4.2% that month.
- Overall: the 2025 tariff effect on headline inflation was smaller than some early forecasts of 6%+.
Legal reversal and a new legal basis, early 2026
- In February 2026 the Supreme Court struck down the IEEPA emergency-powers tariffs (Learning Resources, Inc. v. Trump, 20 February 2026: IEEPA “does not authorize the President to impose tariffs”). Inflation eased to 2.4% in January–February 2026 after tariff pauses and legal challenges.
- The administration then imposed a 10% global tariff under a different law (Section 122 of the Trade Act of 1974), later raised to 15%, with other tariffs (Section 232 / Section 301) staying in force. Flag — sources disagree on the applied rate: the 15% was announced on 21 February 2026, but reporting in May 2026 noted the rate actually applied was still 10%; the Section 122 tariff was time-limited to 150 days and was succeeded in July 2026 by Section 301 duties.
Iran war energy shock, 2026 — the main driver of the renewed rise
- Trigger: US–Israeli strikes on Iran on 28 February 2026; oil rose above $100 a barrel.
- Fuel: gasoline jumped 21.2% in March 2026; by September 2026 gasoline was up 34.2% year-on-year, fuel oil up 74% and diesel / other motor fuels up 60.9% year-on-year. For reference, US regular gasoline had averaged $3.10 a gallon in 2025 (EIA); average gasoline was $4.32 a gallon in mid-October 2026, about $1.30 higher than a year earlier.
- Headline CPI: September 2026 CPI rose 0.6% month-on-month and 3.7% year-on-year (up from 3.4% in August), with gasoline accounting for more than half the monthly increase (BLS release USDL-26-1574). Core CPI was 2.6% year-on-year in September, up from 2.4% in August. Inflation had reached 4.2% in May 2026 and remained above 3.4% afterwards.
Other second-term drivers — attributed, not settled
- Labour supply: immigration restrictions shrinking the labour force and worker shortages, cited for example in September 2026 reporting on gardening / lawn-care services.
- AI buildout: data-centre construction driving chip, electrical-component and power-equipment costs.
- Housing — a disinflationary offset: housing inflation decelerated from 5.40% in 2024 to a 3.90% average in 2025 and an expected 3.2% in 2026, with market rents up only about 1% year-on-year in July 2026.
- Healthcare and electricity: healthcare cost rises linked by commentators to Medicaid cuts and lapsed ACA tax credits; residential electricity up 14% since January 2025.
- Fiscal position: deficits near 6% of GDP, alongside tax cuts and new spending, cited as background demand pressure.
- Fed response: in September 2026 the Fed raised rates by 25 basis points to 3.75–4.00% — its first hike in three years, according to Reuters reporting.
Distinction to keep: in 2025 the tariff effect was smaller than some early 6%+ forecasts; the 2026 rise was driven mainly by the energy shock, with tariffs still contributing to goods prices. That is also the context for the separate 2026 “virtually no inflation” claim at No. 22.
Bottom line for this claim: the low Trump-era rate and the high Biden-era rate were both driven largely by conditions — a calm, then a pandemic-shocked, world economy, energy prices, supply capacity and Fed policy — amplified in 2021–22 by very large fiscal support begun under Trump and completed under Biden. None of that makes “no inflation” true, and the 21% remains a four-year cumulative total, not an annual rate or a record. The second term (above) repeats the pattern in miniature: a genuinely lower rate in 2025, then a renewed, energy-led rise in 2026.
Charts — the readings behind this entry
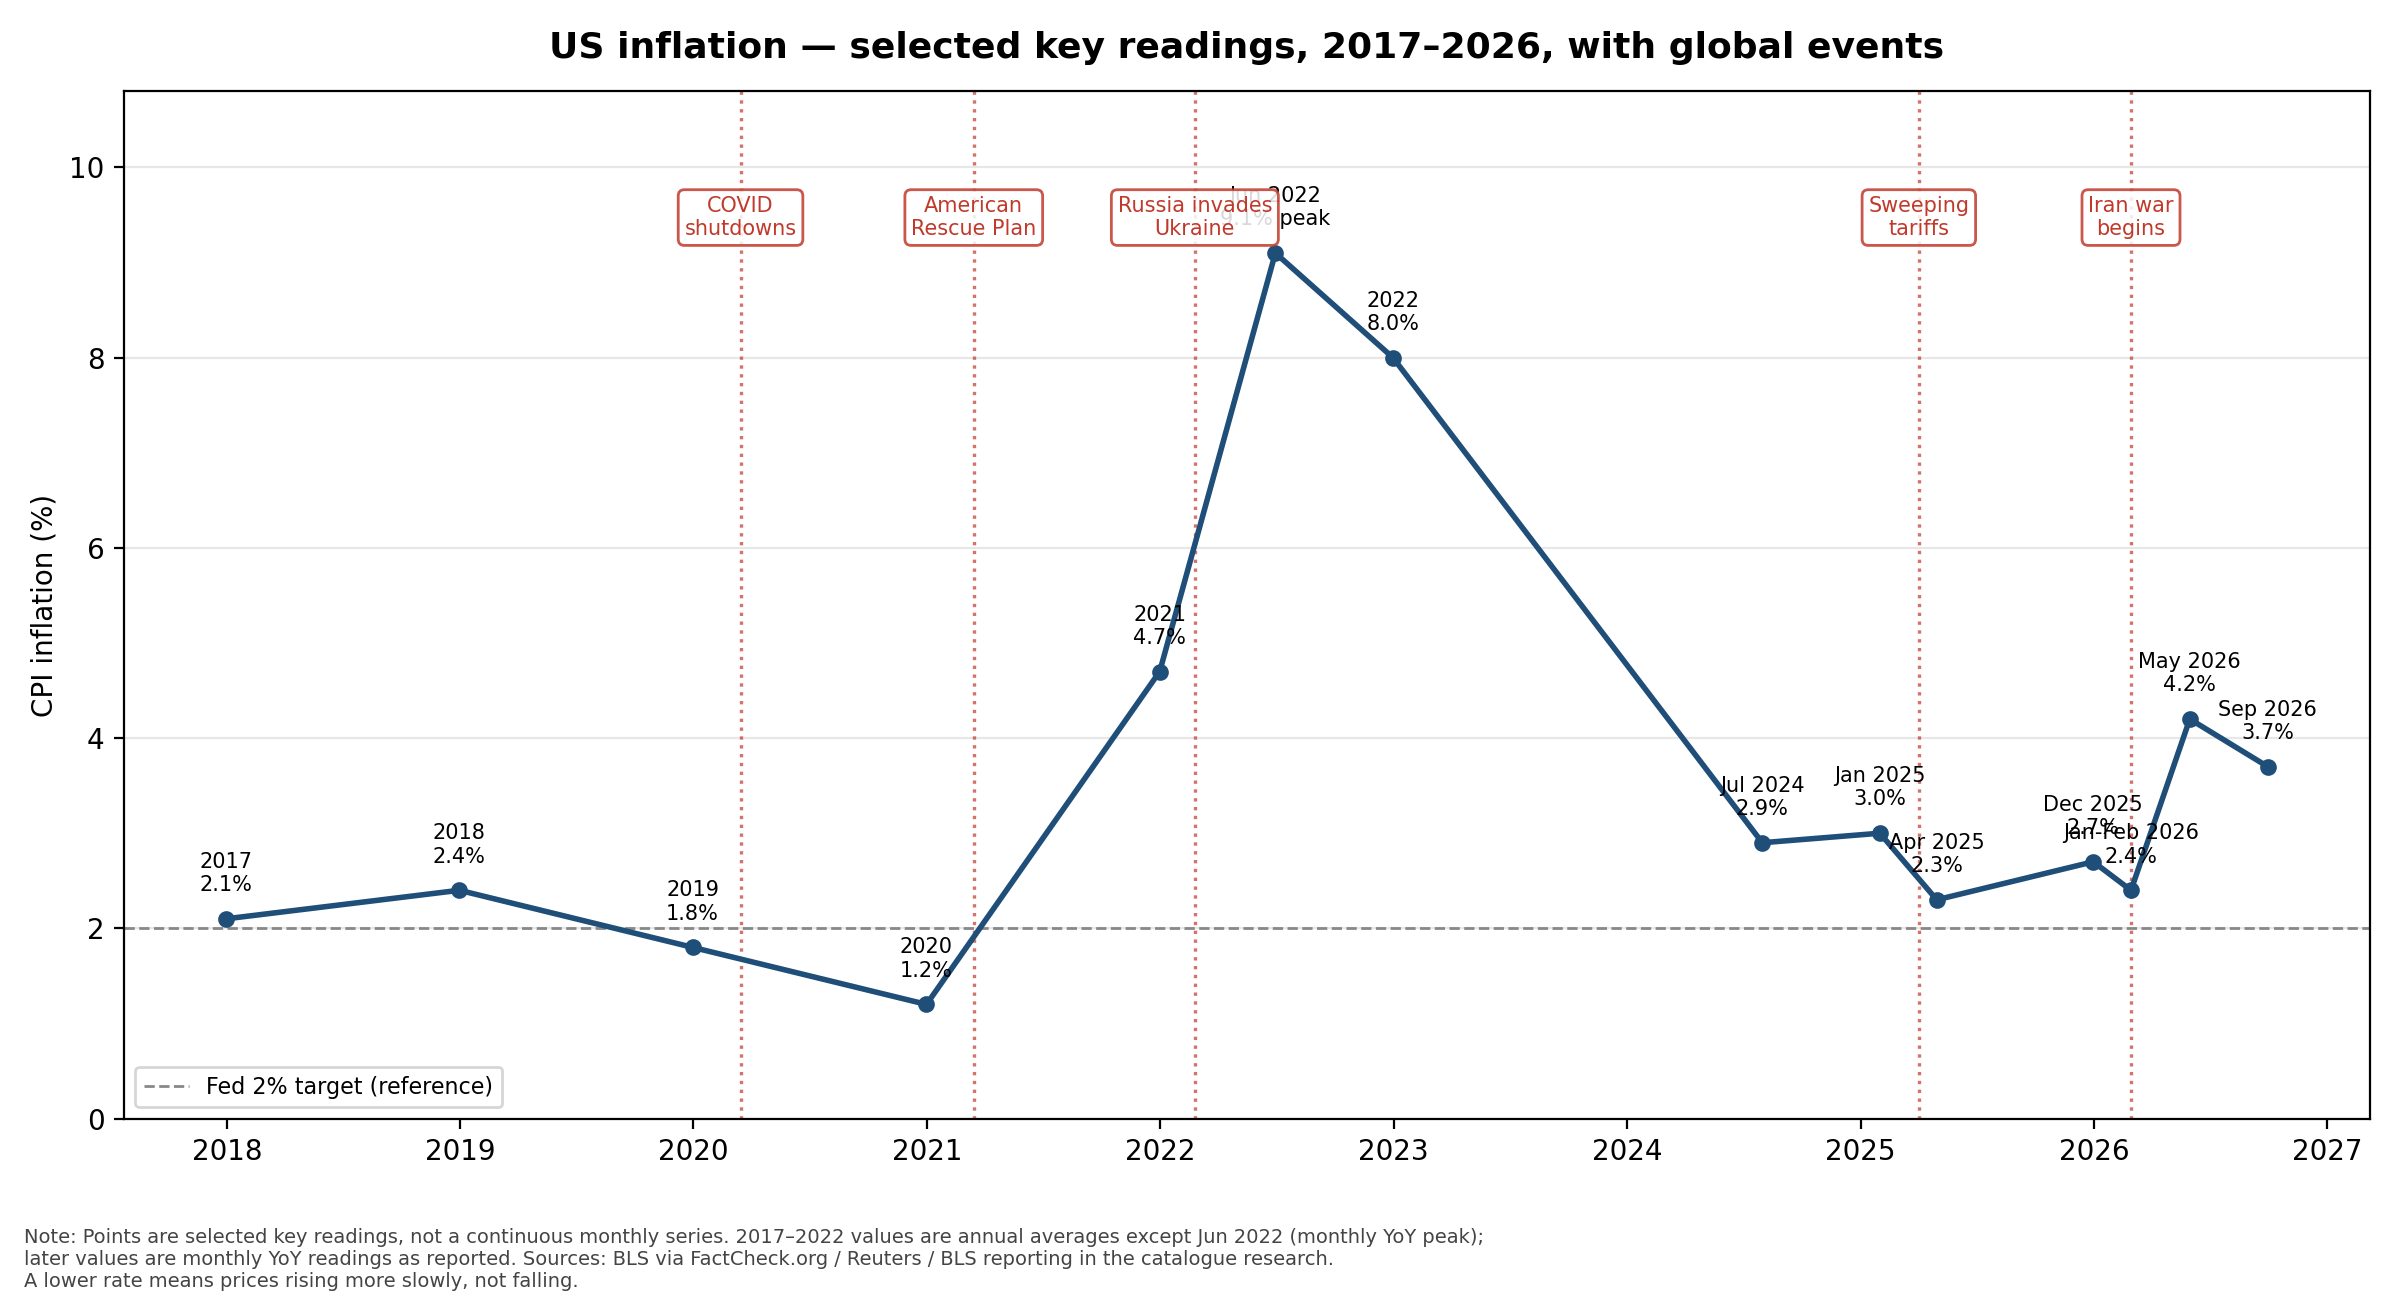
| Reading | CPI inflation | Note |
|---|---|---|
| 2017 (annual average) | 2.1% | Trump first term |
| 2018 (annual average) | 2.4% | Trump first term |
| 2019 (annual average) | 1.8% | Trump first term |
| 2020 (annual average) | 1.2% | COVID demand collapse |
| 2021 (annual average) | 4.7% | Reopening; American Rescue Plan (Mar 2021) |
| June 2022 (monthly, year-on-year) | 9.1% | Peak — after Russia’s invasion of Ukraine |
| 2022 (annual average) | 8.0% | |
| July 2024 (monthly) | 2.9% | Disinflation after Fed hikes |
| January 2025 | 3.0% | Trump returns to office |
| April 2025 | 2.3% | Sweeping tariffs announced (Apr 2025) |
| September 2025 | 3.0% | |
| December 2025 | 2.7% | December-to-December; Dec 2024 was 2.9% |
| January–February 2026 | 2.4% | After tariff pauses; Supreme Court IEEPA ruling (20 Feb 2026) |
| May 2026 | 4.2% | After the Iran war began (28 Feb 2026) |
| August 2026 | 3.4% | Core CPI 2.4% year-on-year |
| September 2026 | 3.7% | +0.6% month-on-month; core CPI 2.6% year-on-year, up from 2.4% in August; gasoline accounted for more than half the monthly rise |
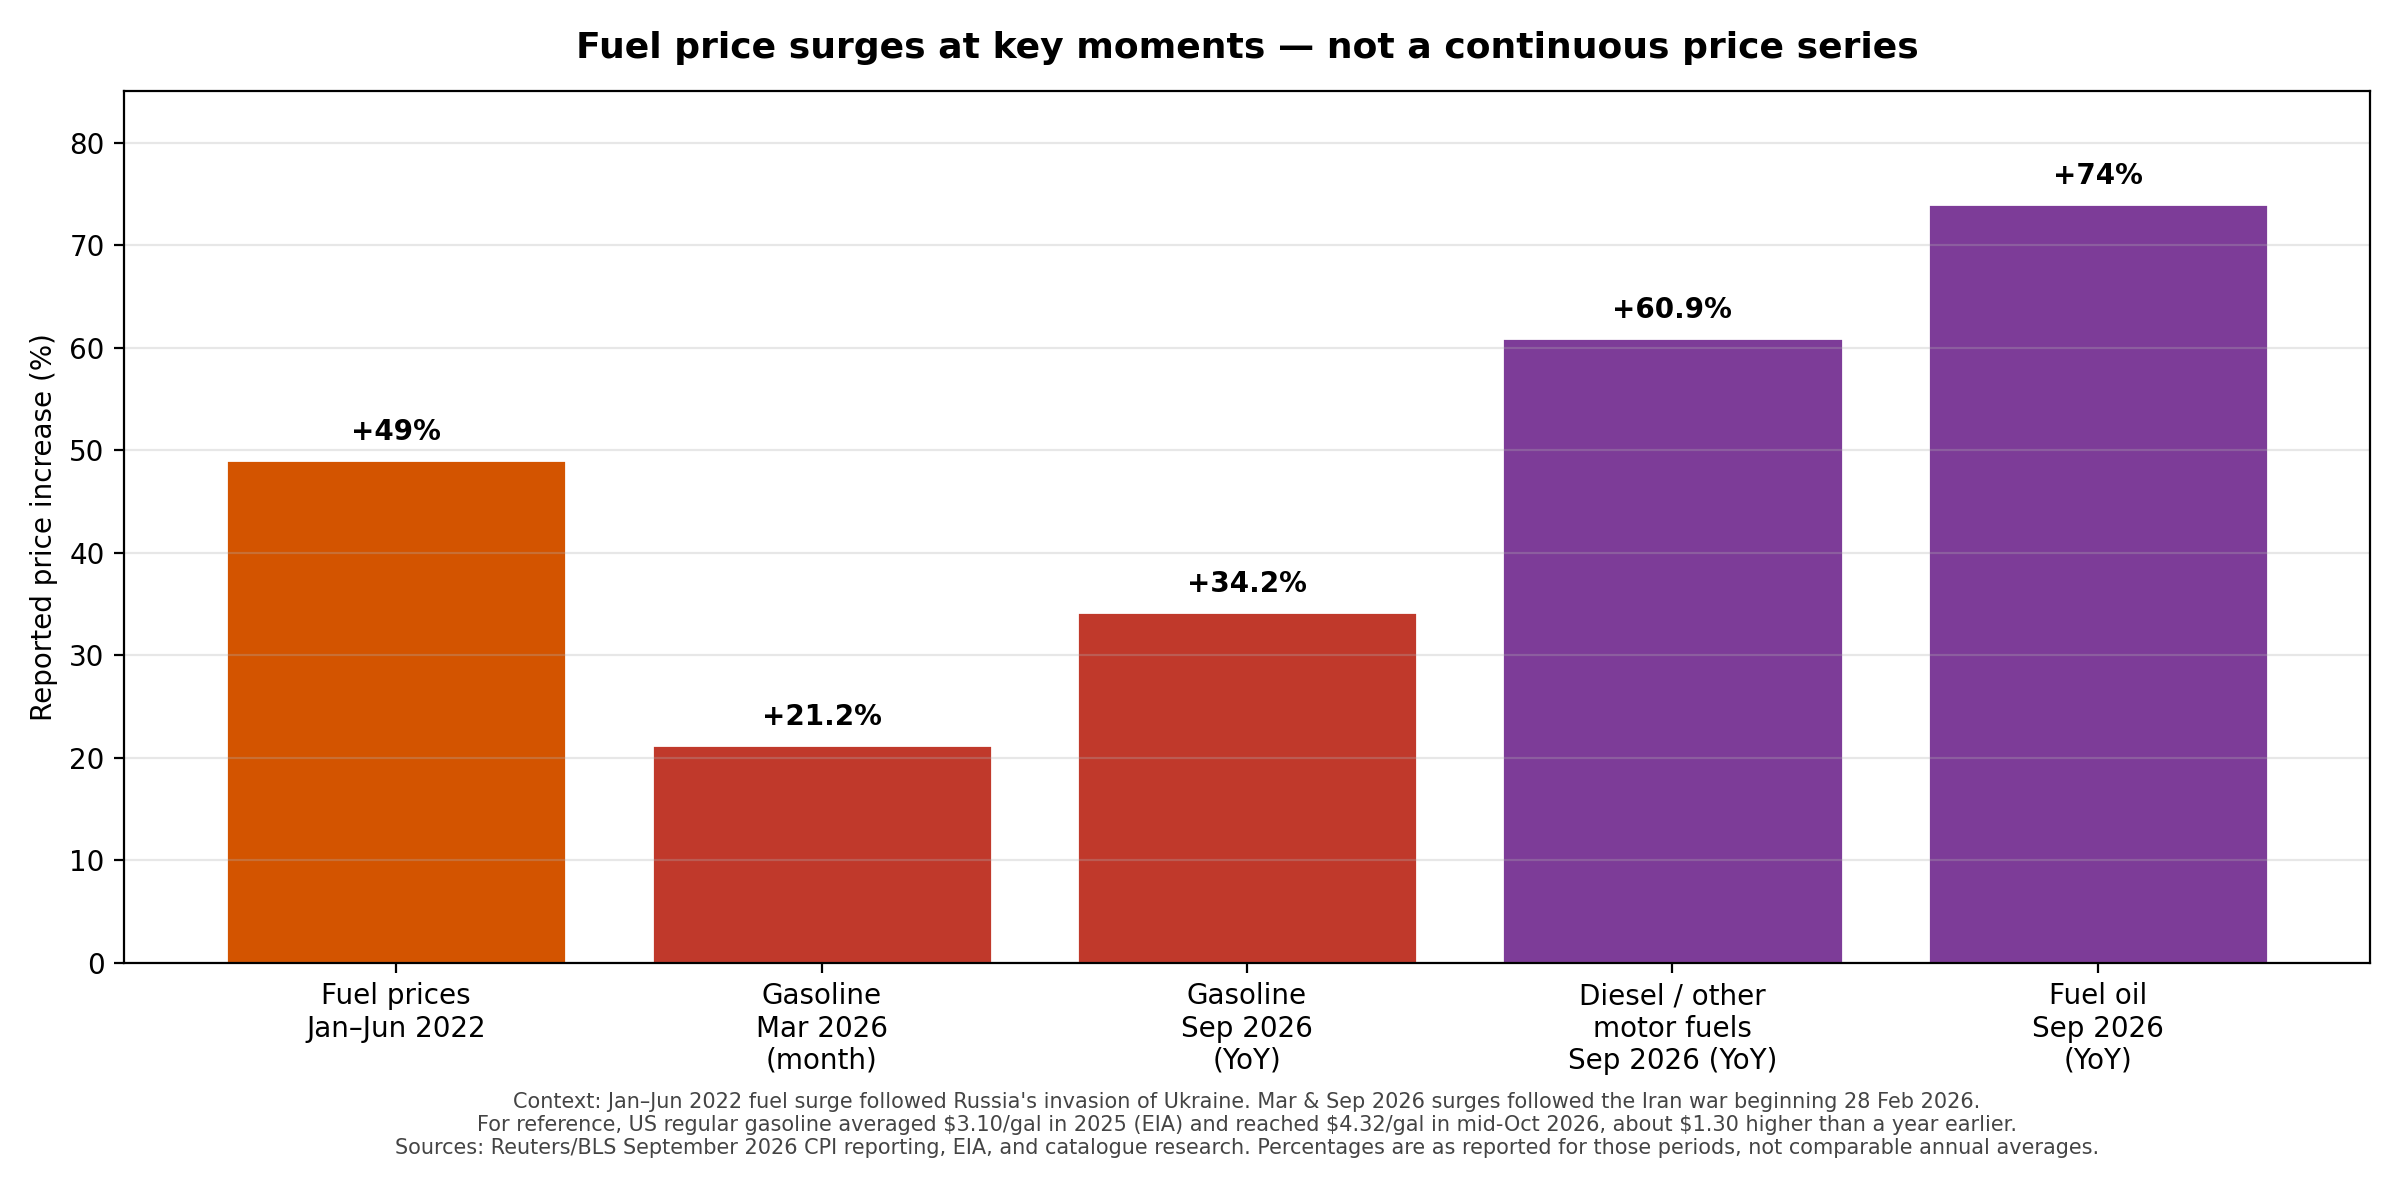
| Moment | Reported increase | Context |
|---|---|---|
| Fuel prices, January–June 2022 | +49% | After Russia’s invasion of Ukraine (Feb 2022) |
| Gasoline, March 2026 (month) | +21.2% | After the Iran war began (28 Feb 2026); oil above $100/barrel |
| Gasoline, September 2026 (year-on-year) | +34.2% | Gasoline accounted for more than half of September 2026’s monthly CPI increase |
| Diesel / other motor fuels, September 2026 (year-on-year) | +60.9% | Iran-war energy shock |
| Fuel oil, September 2026 (year-on-year) | +74% | Iran-war energy shock |
Correction / response
None reported.
Checked by: FactCheck.org — FactChecking the Harris-Trump Debate · FactCheck.org — Biden's Final Numbers · CBO — A Visual Guide to Inflation From 2020 Through 2023 · Bernanke & Blanchard (Brookings) — What Caused the US Pandemic-Era Inflation? · Federal Reserve Bank of New York — How Fast Do Tariffs Pass Through into Consumer Prices? · Reuters via The Hindu BusinessLine — US inflation rises to 3.7% in September 2026; Fed September hike to 3.75–4.00% · PIIE — Can the courts end Trump's tariffs? (IEEPA ruling and Section 122 replacement) · CNN — Trump's fictional inflation numbers (cumulative +5.4% this term) · BLS September 2026 CPI (USDL-26-1574), as reported